🔔SPOTLIGHT: Using Local Bluetooth Device Count to Predict Depressive Symptom Severity
PAPER Spotlight: “Predicting Depressive Symptom Severity Through Individuals’ Nearby Bluetooth Device Count Data Collected by Mobile Phones: Preliminary Longitudinal Study” 10.2196/29840.
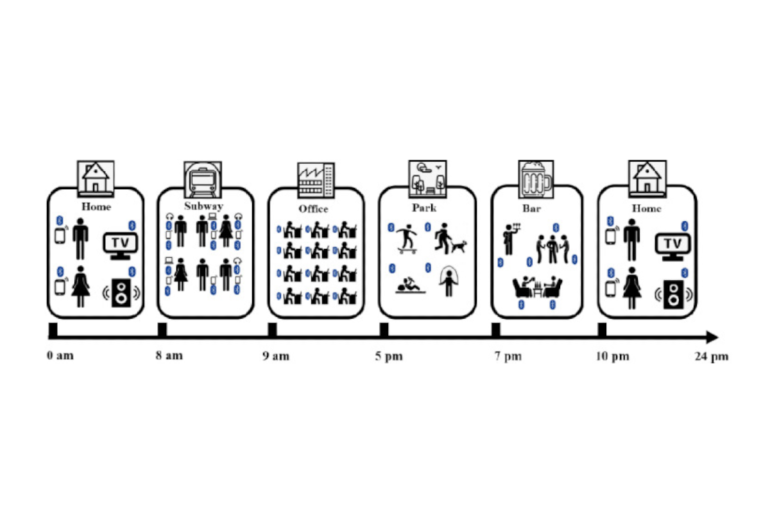
Bluetooth-enabled devices are pervasive in the modern environment, most commonly in the form of smartphones. This study used the RADAR-base Passive app to probe this environment, reporting the count of nearby devices detected. Nearby Bluetooth Device Counts (NBDC) were used to investigate the relationship between this metric and mood/depression. Studies in the field of mental health have discovered correlations between depression and various behaviours and states of individuals, including their social connections, employment status, physical mobility, and experiences of isolation and loneliness. These behaviours and circumstances can be approximated using the nearby Bluetooth device count (NBDC) captured by Bluetooth sensors on mobile phones.
The present study utilized a dataset comprising 2886 bi-weekly PHQ-8 assessments obtained from 316 participants sourced from three research locations in the Netherlands, Spain, and the United Kingdom, as part of the EU RADAR-CNS study. From the NBDC data available for two weeks prior to each PHQ-8 score, 49 Bluetooth features, including statistical and non-linear features, were extracted to measure the individuals’ rhythm periodicity and regularity. Associations between Bluetooth features and PHQ-8 scores were explored using linear mixed-effects models. Subsequently, hierarchical Bayesian linear regression models were employed to predict PHQ-8 scores based on the extracted Bluetooth features.
| Category | Abbreviation | Description | Number of features (N=49) |
| Statistical features | [Second-order feature]_[Daily feature], eg, Max_Mean | Second-order features (max, min, mean, and standard deviation) calculated in the PHQ-8a interval based on daily statistical Bluetooth features (max, min, mean, and standard deviation). | 16 |
| Multiscale entropy (MSE) | MSE_1, MSE_2, …, MSE_24 | Multiscale entropy of the NBDCb sequences from scale 1 to scale 24. | 24 |
| Frequency domainc | LF_sum, MF_sum, HF_sum | The sums of spectrum power in LF, MF, and HF. | 3 |
| Frequency domain | LF_pct, MF_pct, HF_pct | The percentages of spectrum power in LF, MF, and HF to the total spectrum power. | 3 |
| Frequency domain | LF_se, MF_se, HF_se | Spectral entropy in LF, MF, and HF. | 3 |
aPHQ-8: 8-item Patient Health Questionnaire.
bNBDC: nearby Bluetooth device count.
cLF: low frequency (0-0.75 cycles/day); MF: middle frequency (0.75-1.25 cycles/day); HF: high frequency (>1.25 cycles/day).
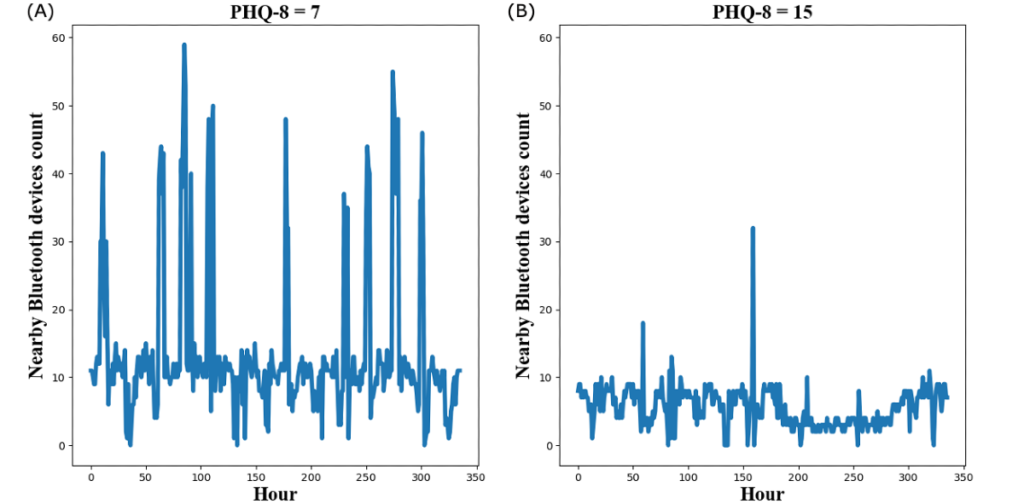
The analysis of the data revealed a number of statistically significant associations between Bluetooth features and the severity of depressive symptoms. In general, it was found that as the severity of depressive symptoms worsened, one or more of the following changes were observed in the two weeks preceding the PHQ-8 assessment: (1) a decrease in the amount of data, (2) a decrease in the variance, (3) a decrease in the periodicity, particularly in the circadian rhythm, and (4) a heightened irregularity in the NBDC sequence. The proposed hierarchical Bayesian linear regression model demonstrated improved prediction performance compared to commonly used machine learning models, with a coefficient of determination (R2) of 0.526 and a root mean squared error (RMSE) of 3.891. The inclusion of Bluetooth features in the model accounted for an additional 18.8% of the variance in the PHQ-8 scores as compared to a baseline model without Bluetooth features (R2=0.338, RMSE=4.547).
The results of our statistical analysis suggest that the NBDC data can serve as an indicator of changes in an individual’s behaviour and well-being concurrent with changes in their depressive state. The prediction results indicate a significant value in using NBDC data for the prediction of depressive symptom severity. These findings hold potential applications in the field of mental health monitoring in real-world settings.
The project is led by Dr Yuezhou, Dr Amos Folarin and Prof. Richard Dobson
Read more: